Mastering the Long/Short Tool - your visual roadmap for risk management
What is the Long/Short Tool in TradingView, and why does it matter before you ever place a trade?
If you are new to trading, one of the fastest ways to build clarity is to make your plan visible on the chart.
Not in your head.
Not as a rough guess.
Not after you are already in the trade.
In this lesson, the goal is simple: use the Long/Short Tool to understand the basic structure of a trade before you ever think about pressing buy or sell.
What is the Long/Short Tool in trading?
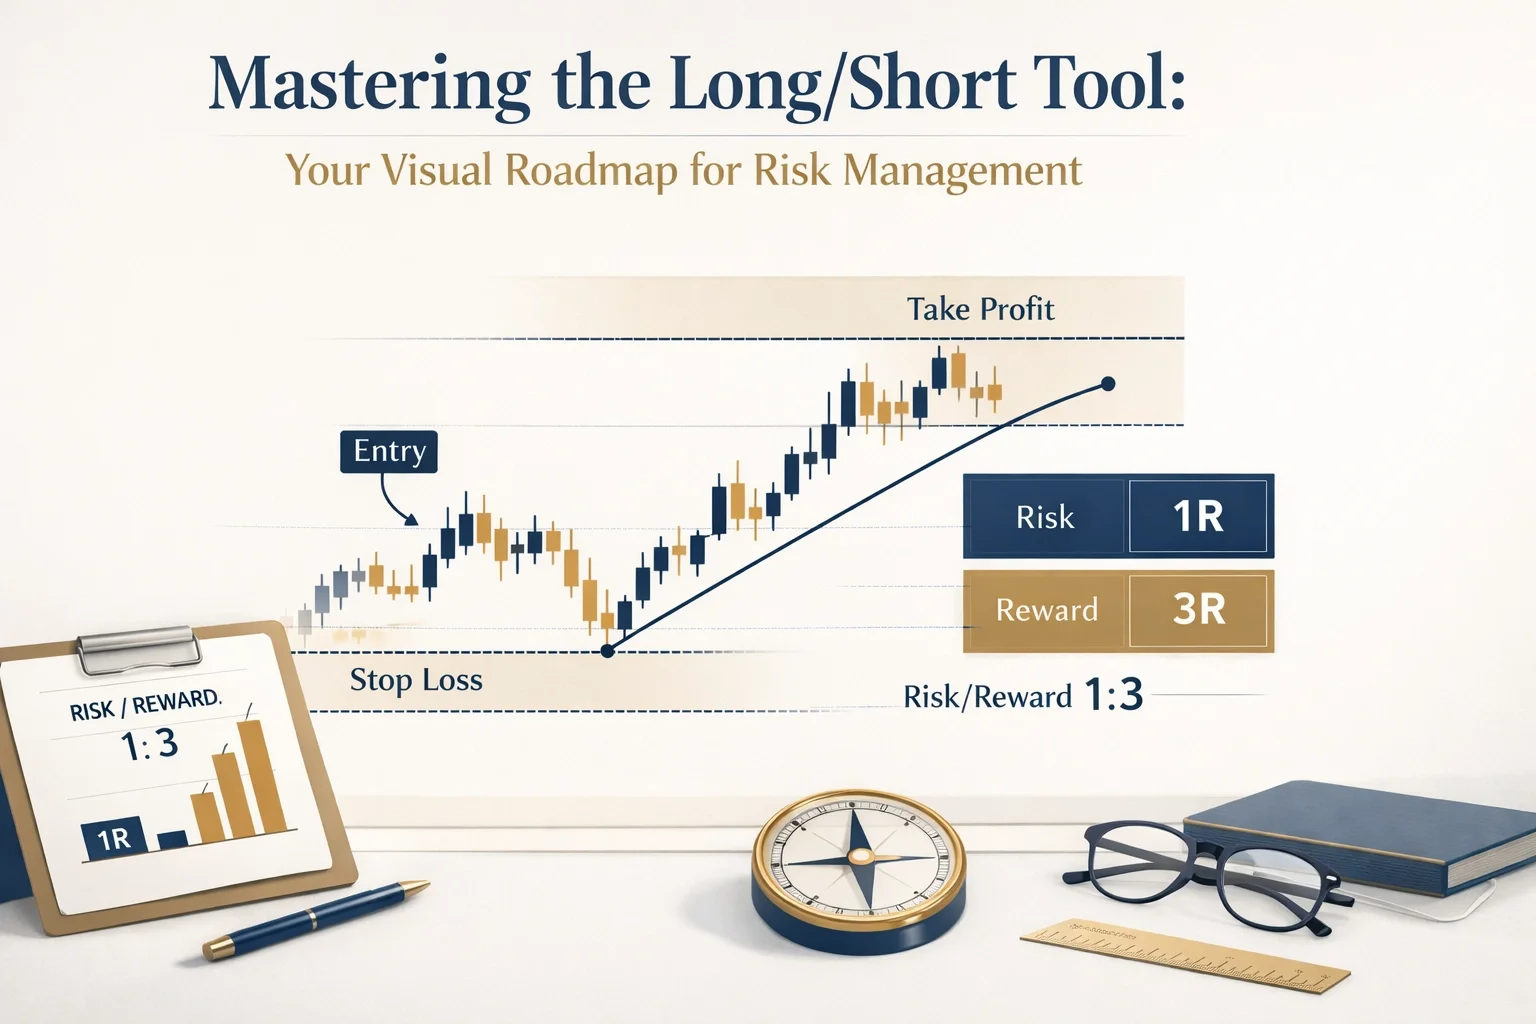
The Long/Short Tool is a drawing feature in TradingView that lets you map a potential trade directly on the chart. It helps you see your entry, stop-loss area, and target area before a trade is taken.
Quick Answer: What Is the Long/Short Tool?
The Long/Short Tool is a planning tool in TradingView.
It helps you map three parts of a trade:
where you would enter
where the trade is wrong
where your target could be
It does not place orders.
It simply helps make your trade plan visible.
What the Long/Short Tool Shows
The Long/Short Tool helps you see the three basic parts of a trade:
Entry
This is the point where your trade idea begins.Stop Loss
This is the level where the trade is no longer valid.Target
This is the area where price could reasonably move if the trade works.
That is the point of this lesson.
You are not trying to make the tool complicated. You are learning to see the structure of a trade clearly before you ever enter one.
Inside the broader Foundations Hub, this lesson sits at the point where chart reading starts becoming trade planning.
How to Use It on the Chart
You can find the Long and Short Position tools inside the left toolbar in TradingView.
Choose Long Position when price is above the EMA structure and your trade idea is in the upward direction.
Choose Short Position when price is below the EMA structure and your trade idea is in the downward direction.
Once you place the tool on the chart, focus on three things:
The entry line
This shows where the trade would begin.The red box
This shows the stop-loss area, or where the trade idea is no longer valid.The green box
This shows the target area, or where price could move if the trade works.
At this stage, you are using the tool to understand trade structure visually.
You are not using it to overanalyze the setup.
Simple Chart Example
Imagine price is sitting above your EMA structure and you want to map a long trade idea.
You place the entry near the candle where the trade idea begins.
You place the red box below the recent low, where the idea would no longer make sense.
Then you place the green box above price, where the move could reasonably go if it continues in your favor.
Now the trade is visible.
You can see the structure before anything happens.
That is what makes the Long/Short Tool so useful for beginners. It helps you stop guessing and start planning.
If you need a quick refresher on the chart setup that comes before this, review Understanding the Exponential Moving Average (EMA).
Think of It Like This
Think of the Long/Short Tool like a visual roadmap for a trade.
Before you go anywhere, you want to know:
where you are starting
where you are wrong
where you are trying to go
That does not make the trade guaranteed.
It just makes the plan clear.
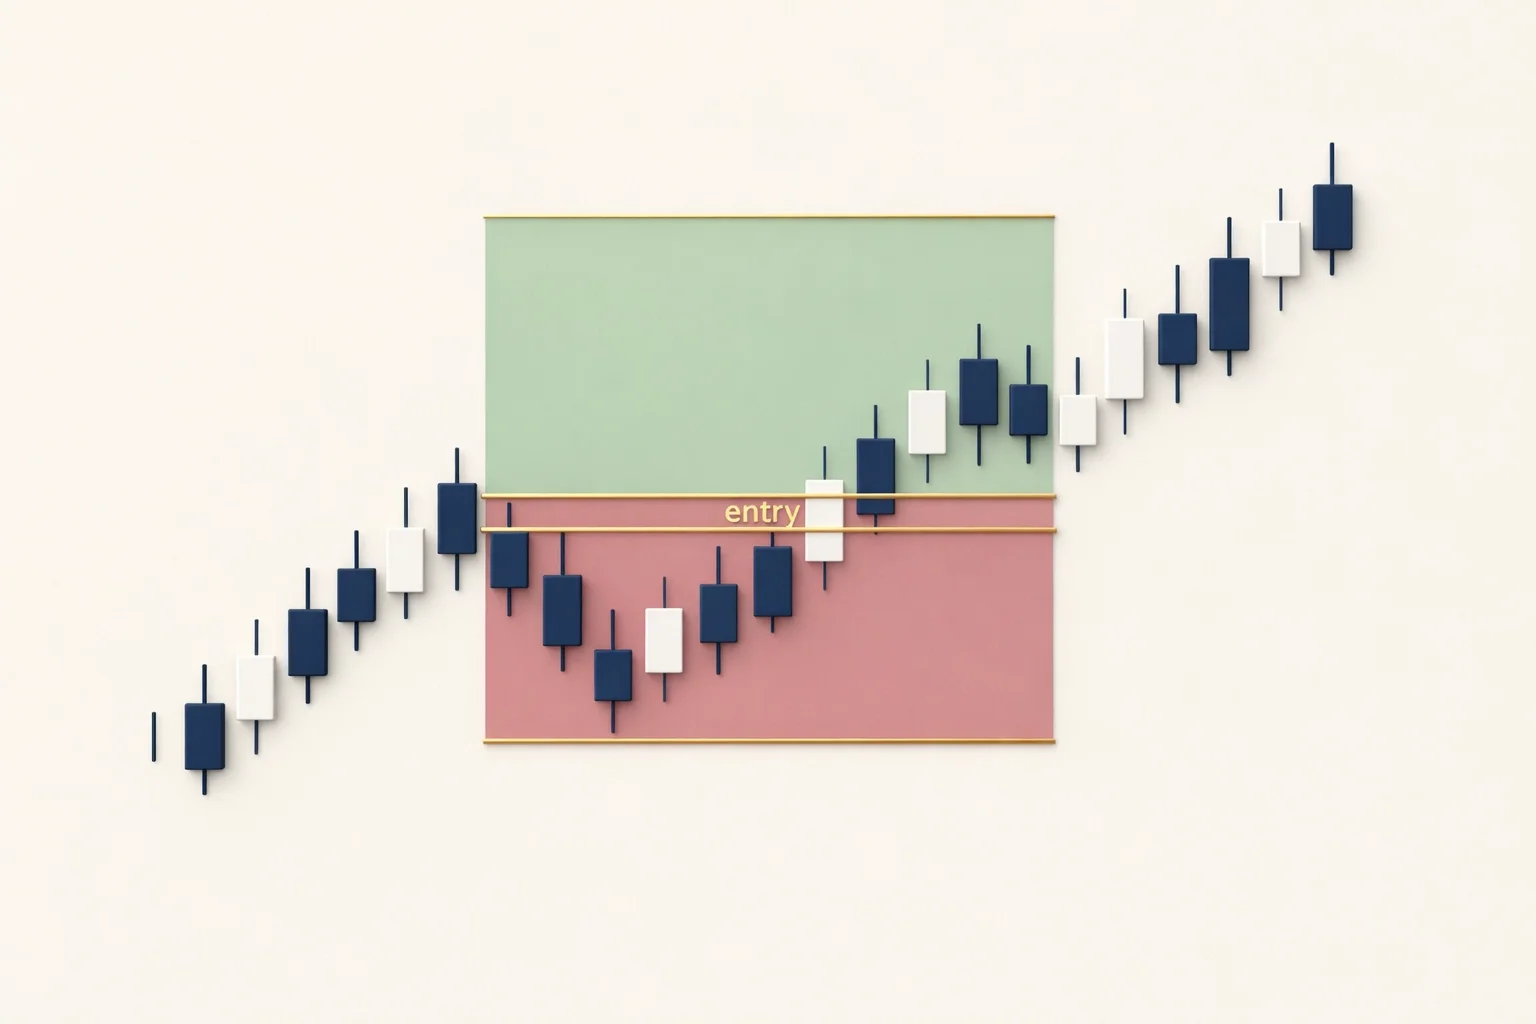
An uncluttered candlestick chart showing the visual given when using the long tool. A red box separates the space from your entry to your stop loss (SL) and a green box separates the space between your entry to your target profit (TP) area.
Common Beginner Mistake: Placing the Tool After the Trade
One of the most common beginner mistakes is placing the Long/Short Tool after entering the trade.
When that happens, the tool stops being a planning tool and starts becoming a way to justify what you already did.
The better habit is simple:
Place the tool first.
Map the entry, stop, and target first.
Then decide whether the trade idea is clear enough to take.
You learn to see before you learn to act.
Most beginners do not struggle with effort. They struggle with structure.
Inside Foundations, these concepts are taught step by step so you are not trying to figure everything out all at once.
How to Practice This Safely
You don’t need real money to learn this skill. In fact, we recommend you don't use real capital yet.
The goal is to build the habit of planning first and executing second.
Step 1 - Add the tool in TradingView
On the left toolbar, find Prediction and Measurement.
Inside you'll see:
• Long Position
• Short Position
Add them to your favorites (click the “star” next to them).
Step 2 - Practice using the EMA context from Lesson 3
Return to the clean 9 EMA / 21 EMA structure we introduced in Lesson 3.
Find a moment where price interacts with the EMA’s in the direction of the trend.
You can see examples of this in live recordings inside The Atrium - the free Foundations tier, community space - where women are supporting women getting started in day trading.
Now place the tool before you enter:
• Entry at the planned candle
• Stop beyond the recent swing
• Target at the next logical price level
• Check the R:R before taking the trade
Step 3 - Paper trade the plan
Focus on process, not profit.
Did price reach your red box or green box first?
These repetitions build the discipline that supports long-term trading skill.
Key Takeaways
The Long/Short Tool is a planning tool, not an order-entry tool.
It helps you map entry, stop, and target directly on the chart.
The point of the tool is to make trade structure visible.
In this lesson, the goal is not exact risk-to-reward calculation.
The goal is to understand the shape of a well-planned trade before entering.
Frequently Asked Questions
What is the Long/Short Tool in TradingView?
The Long/Short Tool is a charting tool that helps you map a trade idea visually by showing entry, stop, and target areas on the chart.
Does the Long/Short Tool place trades for you?
No. It does not place orders. It only helps you plan and visualize a trade idea before entering.
Do I need real money to practice with the Long/Short Tool?
No. Paper trading is the best place to practice with the tool because it lets you build the habit of planning before entering.
What should I focus on first when using the Long/Short Tool?
Focus first on understanding the three basic parts of a trade: entry, stop, and target. At this stage, clarity matters more than complexity.
Next Step
Now that you understand how to map entry, stop, and target on the chart, the next step is learning how to recognize whether the market is moving clearly in one direction or not.
Read next: What Does a Trending Market Look Like?
This Concept Is Part Of: The Agorion Method
This concept is part of the Agorion Method, specifically within the Foundations stage where traders learn to build structure before execution.
The Long/Short Tool matters because it acts as a bridge between reading the chart and planning the trade.
If you want to follow this process from the beginning, start with the Learning Path so you can see how the Agorion Method is designed to build skill step by step.
Continue the Foundations Learning Path
The Foundations Series was created to give women entering day trading a clear step-by-step path to understanding the markets without the noise or overwhelm common in traditional trading education.
Foundations Series Lesson Index
Lesson 1 - What is Leverage in Trading?
Lesson 2 - What is a Candlestick in Trading?
Lesson 3 - Understanding the Exponential Moving Average (EMA)
Lesson 4 - Using the Long/Short Tool to Plan Trades (← You are Here)
Lesson 5 - What does a Trending Market Look Like? (← Read Next)
Lesson 6 - What is Consolidation in Trading?
Lesson 7 - Spread Basics for Beginner Traders
Lesson 8 - Understanding Market Hours in Trading
Lesson 9 - Risk Management Fundamentals
Lesson 10 - What is Margin in Trading?
Lesson 11 - How These Trading Foundations Work Together
By Rachel Pennington
Rachel Pennington is the founder of The Agorion Collective, a structured trading education platform designed to educate and support women building real skill in the market. Her approach is rooted in clarity before complexity, teaching traders to understand price, manage risk, and develop their own process step-by-step.