What Does a Trending Market Look Like in Day Trading?
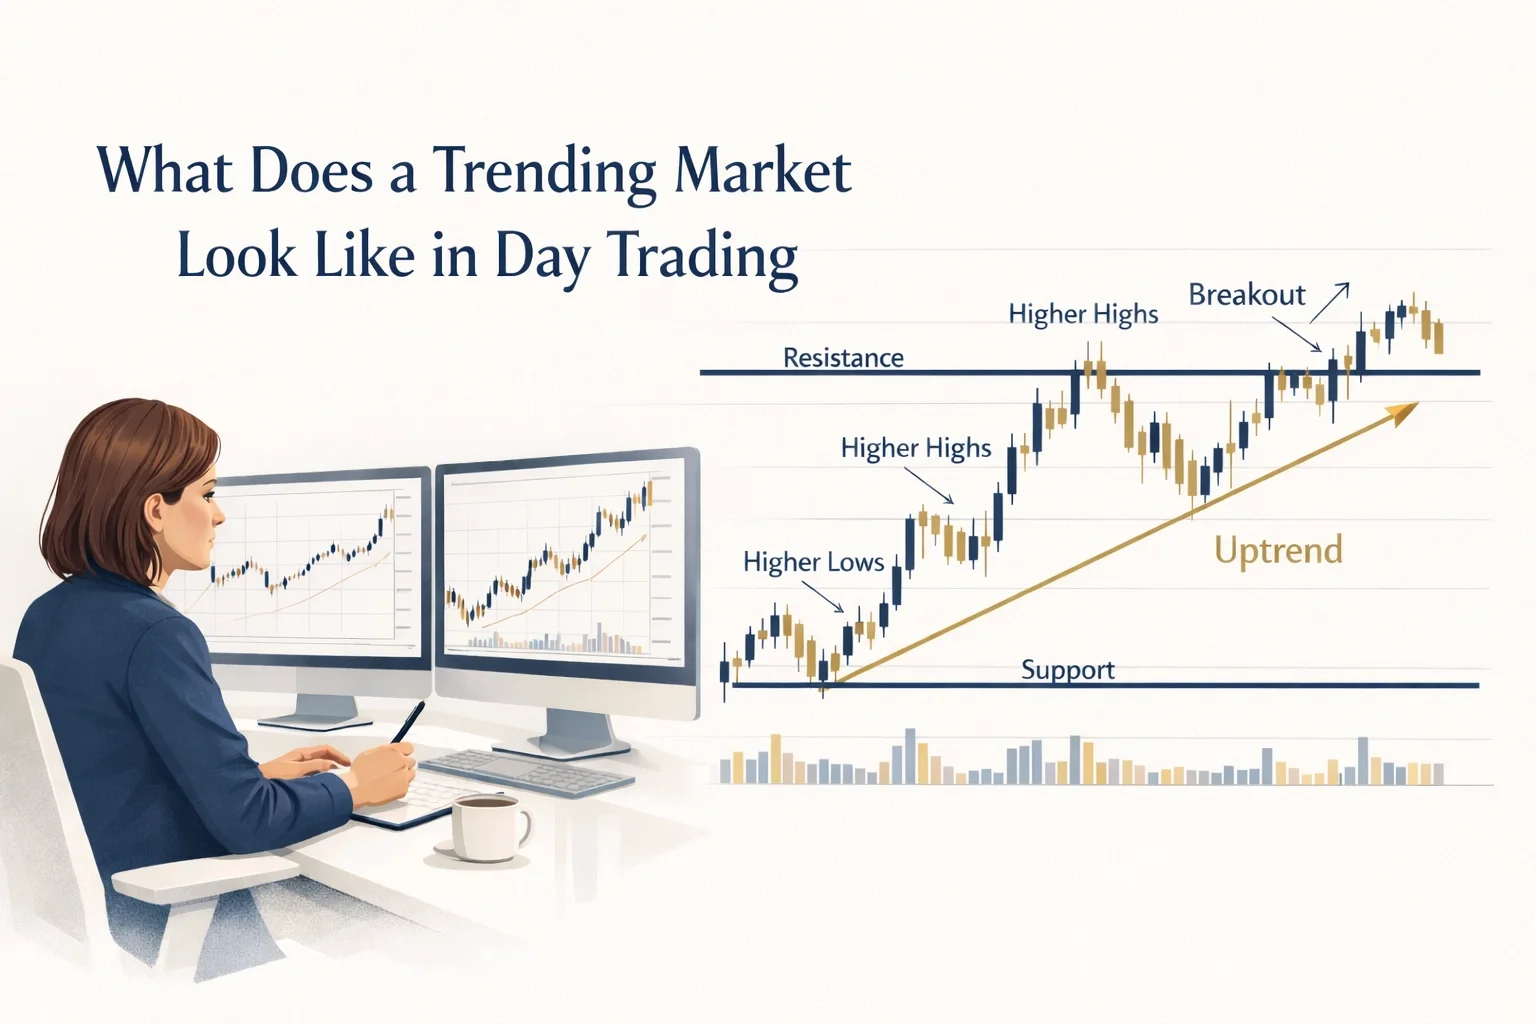
Visual: A women sitting at her desk studying candlestick charts where there is a clear trend of higher highs and higher lows (an Up Trend) being created.
What does a trending market look like in day trading, and how can a beginner tell when price is actually moving with direction?
When you first look at a chart, it can feel messy. Candles move up and down, pull back, push again, and at first it all looks random.
But the market has rhythm.
Once you learn how to recognize that rhythm, price starts to feel less chaotic and much easier to read.
In this lesson, the goal is simple: learn what a trending market looks like so you can tell when price is moving clearly in one direction instead of drifting sideways.
What does a trending market look like in day trading?
A trending market is when price moves clearly in one direction over time instead of moving sideways. In an uptrend, price forms higher highs and higher lows. In a downtrend, price forms lower highs and lower lows.
Quick Answer: What Is a Trending Market?
A trending market moves with clear direction over time.
An uptrend forms higher highs and higher lows.
A downtrend forms lower highs and lower lows.
The goal is not to predict every move. The goal is to recognize whether price is moving with structure or not.
What Is a Trending Market?
At the simplest level, a trending market is when price moves clearly in one direction instead of moving sideways.
Price does not usually move in a straight line. It moves in pushes and pullbacks.
That is why trend is not about one strong candle. It is about the structure price creates over time.
When those pushes and pullbacks keep building in one direction, the market is trending.
Inside the Foundations Series, this lesson is where chart reading starts becoming more structured. You are no longer just looking at individual candles or EMA placement. You are learning to recognize the rhythm of price itself.
How Market Swings Create Trend
One of the first things beginners notice is that price moves in waves.
It pushes.
It pulls back.
Then it pushes again.
Those waves create highs and lows on the chart.
When you begin tracking how those highs and lows are forming, the market starts to feel much less random.
That is the core of trend recognition:
noticing whether price is building upward structure or downward structure.
Identifying an Uptrend: The Staircase Up
An uptrend is like walking up a staircase.
For a market to be in an uptrend, it usually needs to show two things:
Higher highs: each new peak reaches higher than the one before it.
Higher lows: each pullback stays above the previous low.
The visual flow looks like this:
Price pushes upward and creates a new high.
Price pulls back and creates a low that stays higher than the last one.
Price pushes upward again and breaks past the previous high.
When you see this stair-step movement, it tells you buyers are currently in control. They are willing to keep buying at higher prices, and they are not letting price fall back into the previous lows.
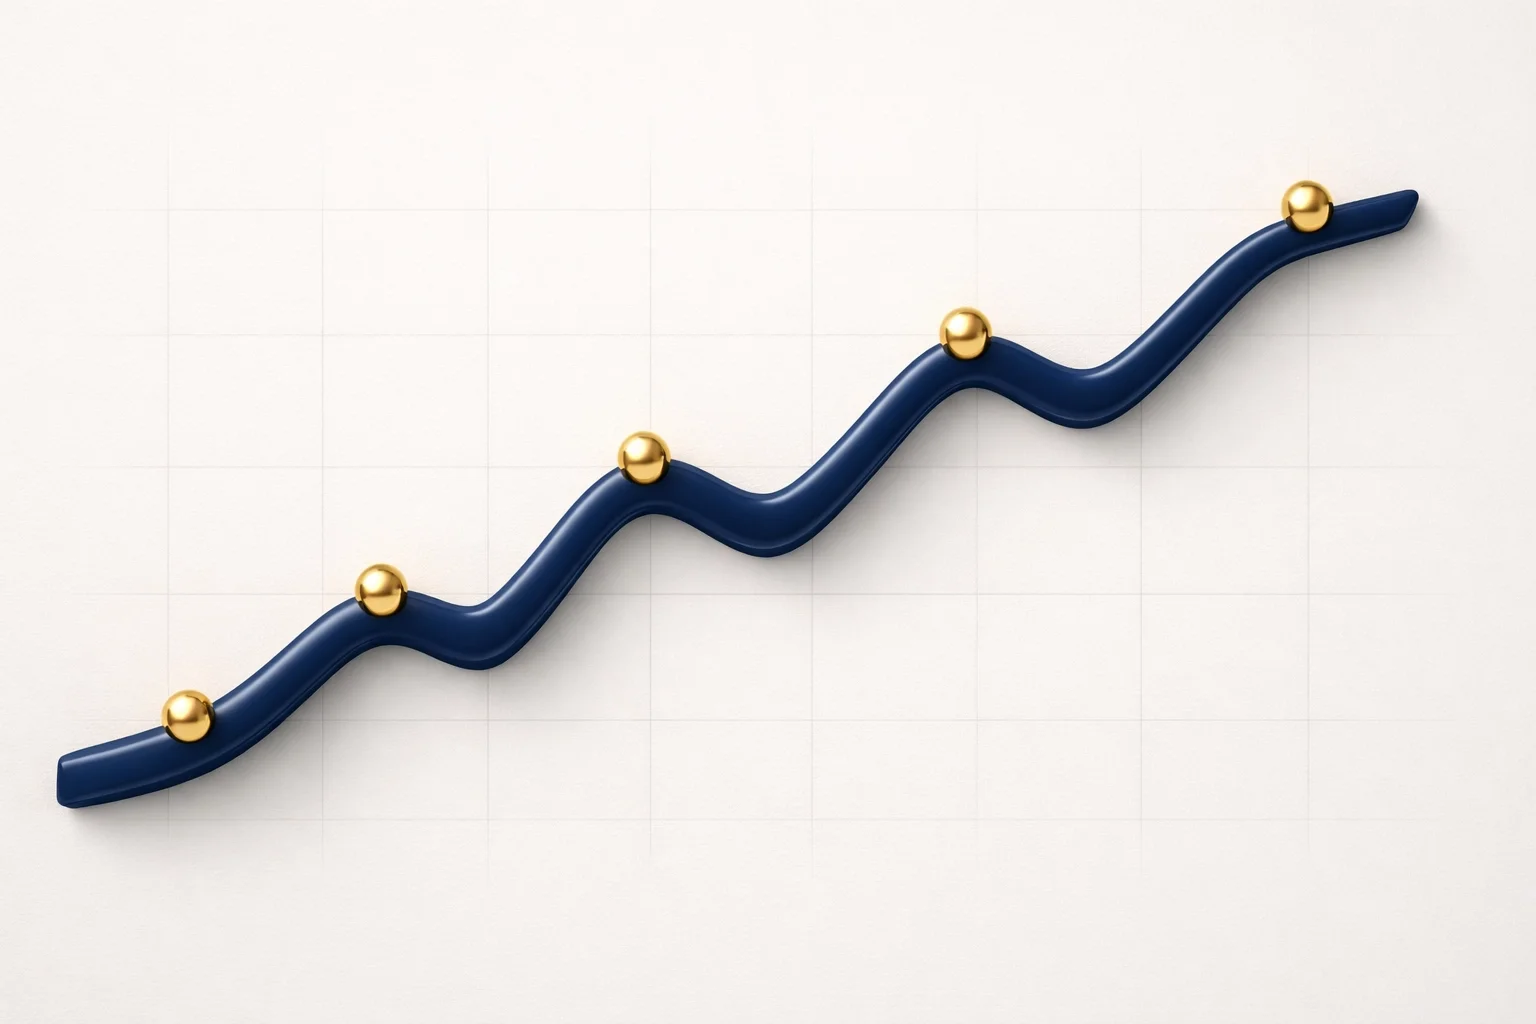
Visual: A clean, labeled diagram of an uptrend showing "HH" at the peaks and "HL" at the valleys, using a soft gold and navy color palette
What a Downtrend Looks Like
A downtrend is the opposite.
A downtrend usually shows:
lower lows
lower highs
That means price drops, bounces, then drops again and breaks below the previous low.
The bounce does not recover back to the previous high. Instead, it forms a lower high before price moves down again.
When you see that pattern repeating, it tells you sellers are currently in control.
If you need a quick refresher on the chart setup that comes before this lesson, review Understanding the Exponential Moving Average (EMA). EMA’s are helpful for begginers day traders to be able to see trends quickly and at a glance.
Think of It Like This
Think of a trending market like a staircase.
In an uptrend, price keeps stepping upward.
In a downtrend, price keeps stepping downward.
The candles may still move back and forth in the short term, but the overall structure keeps building in one direction.
That is what you are learning to notice.
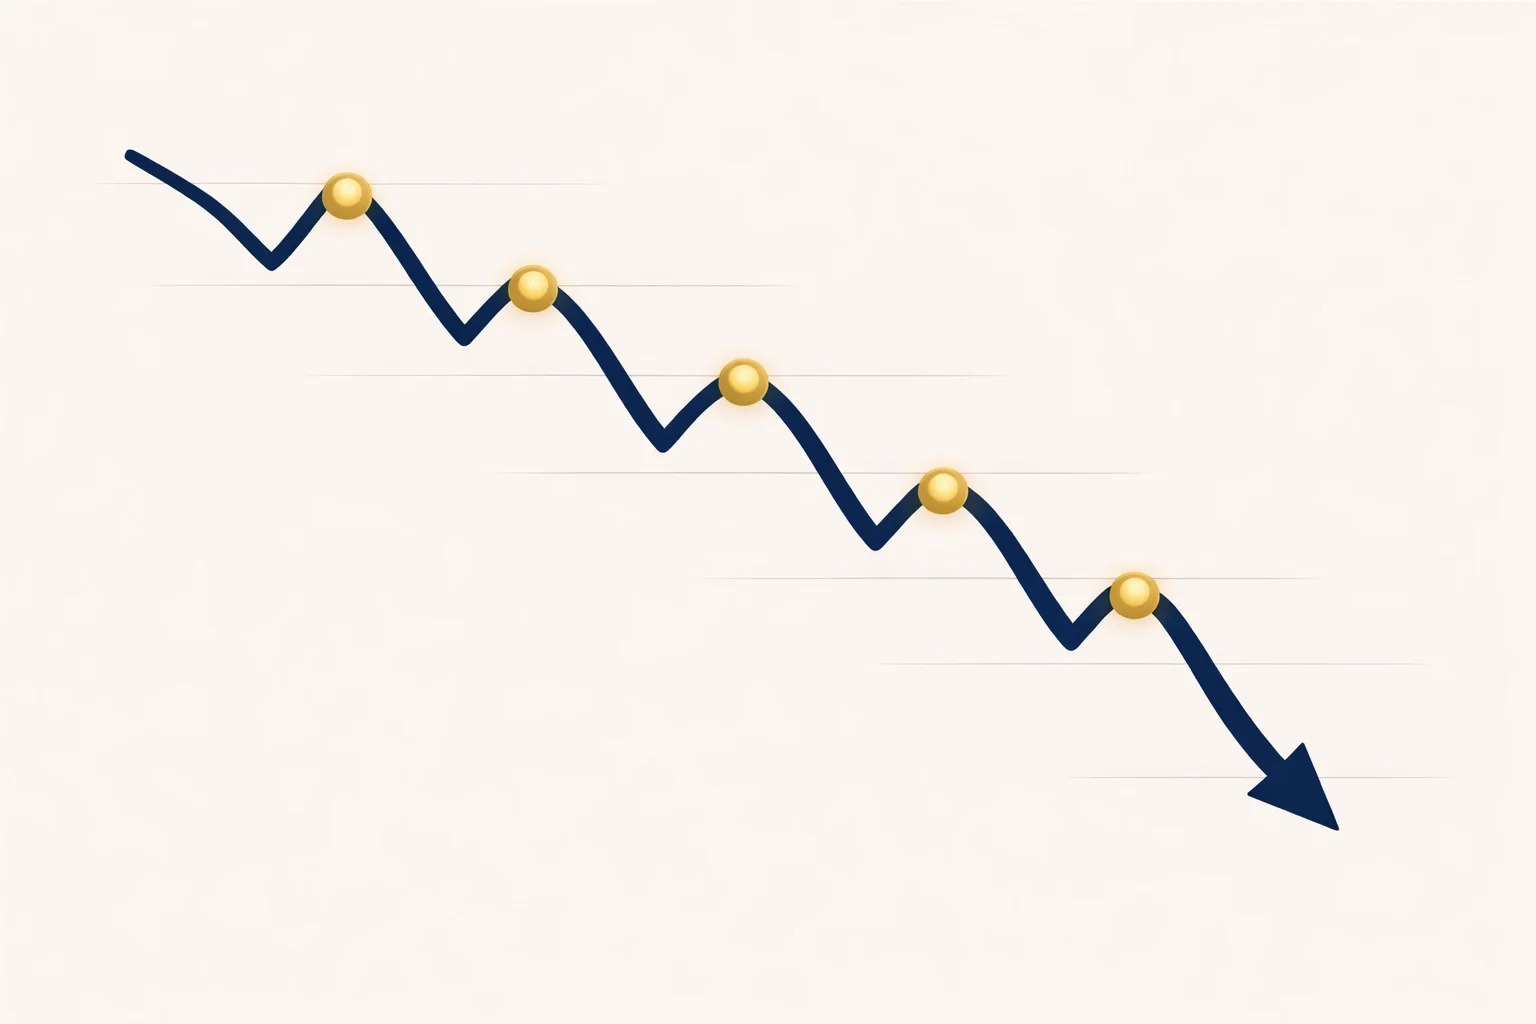
Visual: A clean, labeled diagram of a downtrend showing "LH" at the peaks and "LL" at the valleys, matching the Agorion aesthetic.
Common Beginner Mistake: Focusing on One Candle Instead of the Structure
One of the most common beginner mistakes is focusing too much on a single candle and not enough on the overall structure.
A strong candle by itself does not tell you the full trend.
Trend becomes clearer when you step back and look at the sequence of highs and lows.
The better habit is to ask:
Is price forming higher highs and higher lows?
Or is it forming lower highs and lower lows?
That is what gives the chart context.
You learn to see before you learn to act.
Most beginners do not struggle with effort. They struggle with structure.
Inside Foundations, these concepts are taught step by step so you are not trying to interpret everything at once.
Key Takeaways
A trending market moves clearly in one direction over time.
An uptrend forms higher highs and higher lows.
A downtrend forms lower lows and lower highs.
Trend helps you see who is currently in control: buyers or sellers.
The goal is not to predict perfectly. The goal is to recognize direction clearly before making decisions.
Frequently Asked Questions
How do beginners identify a trending market?
Beginners identify a trending market by looking at price structure. An uptrend forms higher highs and higher lows, while a downtrend forms lower highs and lower lows.
Why is trading with the trend easier for beginners?
Trading with the trend helps beginners work with the current direction of the market instead of trying to predict reversals too early.
Can trends happen on any timeframe?
Yes. Trends can appear on any timeframe. Many beginners find them easier to recognize on slightly larger timeframes because there is less noise.
What happens when a trend stops?
When a trend loses clear direction, price often begins moving sideways. This is called consolidation.
Next Step
Now that you understand what a trending market looks like, the next step is learning what happens when that rhythm stops.
In the next lesson, we’ll look at consolidation, where price moves sideways instead of clearly up or down.
→ Read next: What Is Consolidation in Trading?
This Concept Is Part Of: The Agorion Method
This concept is part of the Agorion Method, specifically within the Foundations stage where traders learn how to read market behavior before moving deeper into execution.
Trend recognition matters because it helps you understand whether price is moving with clear direction or not before you try to build a trade plan around it.
Continue the Foundations Learning Path
The Foundations Series was created to give women entering day trading a clear step-by-step path to understanding the markets without the noise or overwhelm common in traditional trading education.
Foundations Series Lesson Index
Lesson 1 - What is Leverage in Trading?
Lesson 2 - What is a Candlestick in Trading?
Lesson 3 - Understanding the Exponential Moving Average (EMA)
Lesson 4 - Using the Long/Short Tool to Plan Trades
Lesson 5 - What does a Trending Market Look Like? (← You are Here)
Lesson 6 - What is Consolidation in Trading? (← Read Next)
Lesson 7 - Spread Basics for Beginner Traders
Lesson 8 - Understanding Market Hours in Trading
Lesson 9 - Risk Management Fundamentals
Lesson 10 - What is Margin in Trading?
Lesson 11 - How These Trading Foundations Work Together
Ready to start learning with structure?
Start inside Foundations, the first stage of the Agorion Method, where each concept builds on the last so you can develop real trading skill with clarity and confidence.
By Rachel Pennington
Rachel Pennington is the founder of The Agorion Collective, a structured trading education platform designed to educate and support women building real skill in the market. Her approach is rooted in clarity before complexity, teaching traders to understand price, manage risk, and develop their own process step-by-step.