What is an Exponential Moving Average (EMA) in Trading? A Beginners Guide
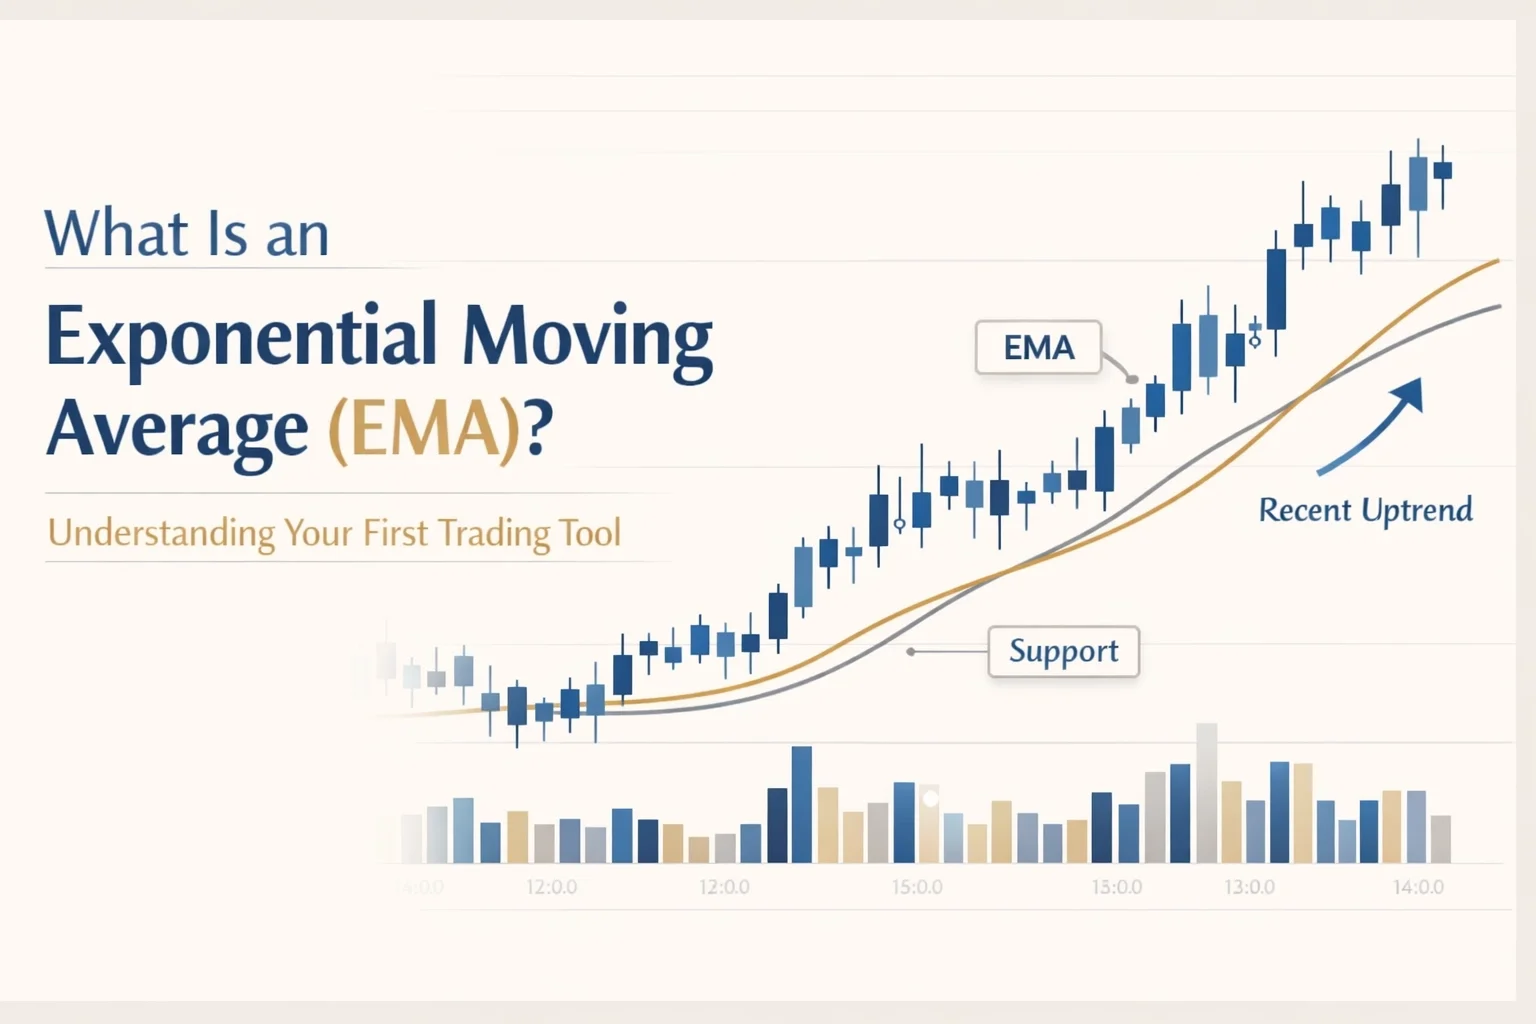
Visual of a candlestick chart where price is moving in an uptrend, above the EMAs.
What is an exponential moving average in trading, and why do beginners use it on a chart?
If you have ever looked at a chart and felt like price was moving too fast to follow, the EMA helps make things easier to see. It gives your eyes a simple reference point so direction feels clearer.
In this lesson, we are keeping it simple. The beginner chart setup uses the 9 EMA and 21 EMA to help you see the general direction of price more clearly without cluttering the chart.
What is an exponential moving average (EMA) in trading?
An exponential moving average, or EMA, is a line on a chart that tracks the average price of an asset over a set number of candles. In the beginner setup, the 9 EMA and 21 EMA help make direction easier to see at a glance.
Quick Answer: What Is an EMA in Trading?
An EMA is a moving average line placed on a chart.
The beginner chart setup uses the 9 EMA and 21 EMA.
These lines help smooth price movement so direction is easier to see.
They are visual guides, not trading signals.
How the 9 EMA and 21 EMA Work
Every candle on your chart shows price movement during a specific period of time.The EMA takes those candles and draws a smoother line so you can see the average direction of price more clearly.
In the beginner chart setup, we use two EMAs:
the 9 EMA
the 21 EMA
The 9 EMA stays a little closer to current price. The 21 EMA gives a slightly wider view.
You do not need to think about these lines in a technical way right now. The goal is simply to use them as visual guides that make direction easier to read.
What the 9 EMA and 21 EMA Help You See
The 9 EMA and 21 EMA help you notice direction more clearly.
If the lines are sloping upward, that tells you price has been moving upward on average.
If the lines are sloping downward, that tells you price has been moving downward on average.
You can also look at where price is sitting in relation to the lines.
When candles are generally above the 9 EMA and 21 EMA, that helps show an upward environment.
When candles are generally below the 9 EMA and 21 EMA, that helps show a downward environment.
That is the main job of this setup in Foundations:
to help you see direction at a glance without overcomplicating the chart.
Inside the Foundations Series, this setup is used early because it helps beginners organize what they are seeing before moving deeper into chart work.
Simple Chart Example
Imagine you are looking at a chart where candles are sitting above both the 9 EMA and 21 EMA.
Both lines are sloping upward.
At a glance, that tells you price has been moving upward on average.
Now imagine a chart where candles are sitting below both lines and both EMAs are sloping downward.
At a glance, that tells you price has been moving downward on average.
You are not using the lines to predict anything here.
You are using them to help your eyes understand direction more quickly and more clearly.

Trading charts showing the movement of EMAs alongside a candlestick chart. “Bullish Price Action shows Candlesticks Above EMAs” and Bearish Price Action Shows Candlesticks Below EMAs”.
Think of It Like This
Think of candlesticks as the individual pieces of price movement.
The 9 EMA and 21 EMA help smooth those pieces into a clearer visual guide.
Instead of getting pulled into every small movement, you can step back and see the general direction more easily.
Common Beginner Mistake: Treating the EMAs Like Signals
One of the most common beginner mistakes is assuming the 9 EMA and 21 EMA tell you exactly when to buy or sell.
That usually happens because beginners want one simple tool to make decisions for them.
But that is not the role of the EMAs in this stage.
Right now, their role is much simpler:
They help you see direction.
They help you keep the chart clean.
They help you avoid piling on extra indicators before you understand what price is doing.
Clarity comes before complexity. So take this oportunity to see the market at its simplist before moving to more complex indicators.
Learn It in Order
Most beginners do not struggle because they lack effort. They struggle because they try to learn too many things at once.
Inside the community Foundations tier, these concepts are taught step by step so you can build structure before moving into more advanced chart work.
Key Takeaways
The beginner chart setup uses the 9 EMA and 21 EMA.
These lines help smooth price movement so direction is easier to see.
If the EMAs slope upward, direction is generally rising.
If the EMAs slope downward, direction is generally falling.
Price above or below the EMAs helps you see general flow more clearly.
The EMAs are visual guides, not decision-makers.
Frequently Asked Questions
What is an EMA in trading?
An EMA is a moving average line on a chart that helps show the average direction of price over recent candles.
Why do beginners use both the 9 EMA and 21 EMA?
Beginners use both because the 9 EMA gives a closer view of recent price movement, while the 21 EMA gives a slightly wider view. Together, they make direction easier to see.
Does EMA work on different timeframes?
Yes. EMAs can be used on different timeframes because they are based on the candles shown on that chart. The key is to use them as visual guides for direction, not as automatic signals.
Can beginners use EMA on forex, futures, or other markets?
Yes. EMAs can be used on different markets because they are based on price movement. In Foundations, they are used to help beginners read direction more clearly on a clean chart.
Next Step
Now that you understand what the 9 EMA and 21 EMA help you see, the next step is learning how to use that chart structure with a practical tool for mapping trades.
Read next: Using the Long/Short Tool to Plan Trades
This Concept Is Part Of: The Agorion Method
This concept is part of the Agorion Method, specifically within the Foundations stage where traders learn to build structure before moving into more applied chart work.
The 9 EMA and 21 EMA are part of that beginner setup because they help traders see direction clearly before trying to do more with the chart.
If you want to follow this process from the beginning, start with the Learning Path so you can see how the Agorion Method is designed to build skill step by step.
Continue the Foundations Learning Path
The Foundations Series was created to give women entering day trading a clear step-by-step path to understanding the markets without the noise or overwhelm common in traditional trading education.
Foundations Series Lesson Index
Lesson 1 - What is Leverage in Trading?
Lesson 2 - What is a Candlestick in Trading?
Lesson 3 - Understanding the Exponential Moving Average (EMA) (← You are Here)
Lesson 4 - Using the Long/Short Tool to Plan Trades (← Read Next)
Lesson 5 - What does a Trending Market Look Like?
Lesson 6 - What is Consolidation in Trading?
Lesson 7 - Spread Basics for Beginner Traders
Lesson 8 - Understanding Market Hours in Trading
Lesson 9 - Risk Management Fundamentals
Lesson 10 - What is Margin in Trading?
Lesson 11 - How These Trading Foundations Work Together
By Rachel Pennington
Rachel Pennington is the founder of The Agorion Collective, a structured trading education platform designed to educate and support women building real skill in the market. Her approach is rooted in clarity before complexity, teaching traders to understand price, manage risk, and develop their own process step-by-step.