What Is a Candlestick in Trading? How to Read Price Movement
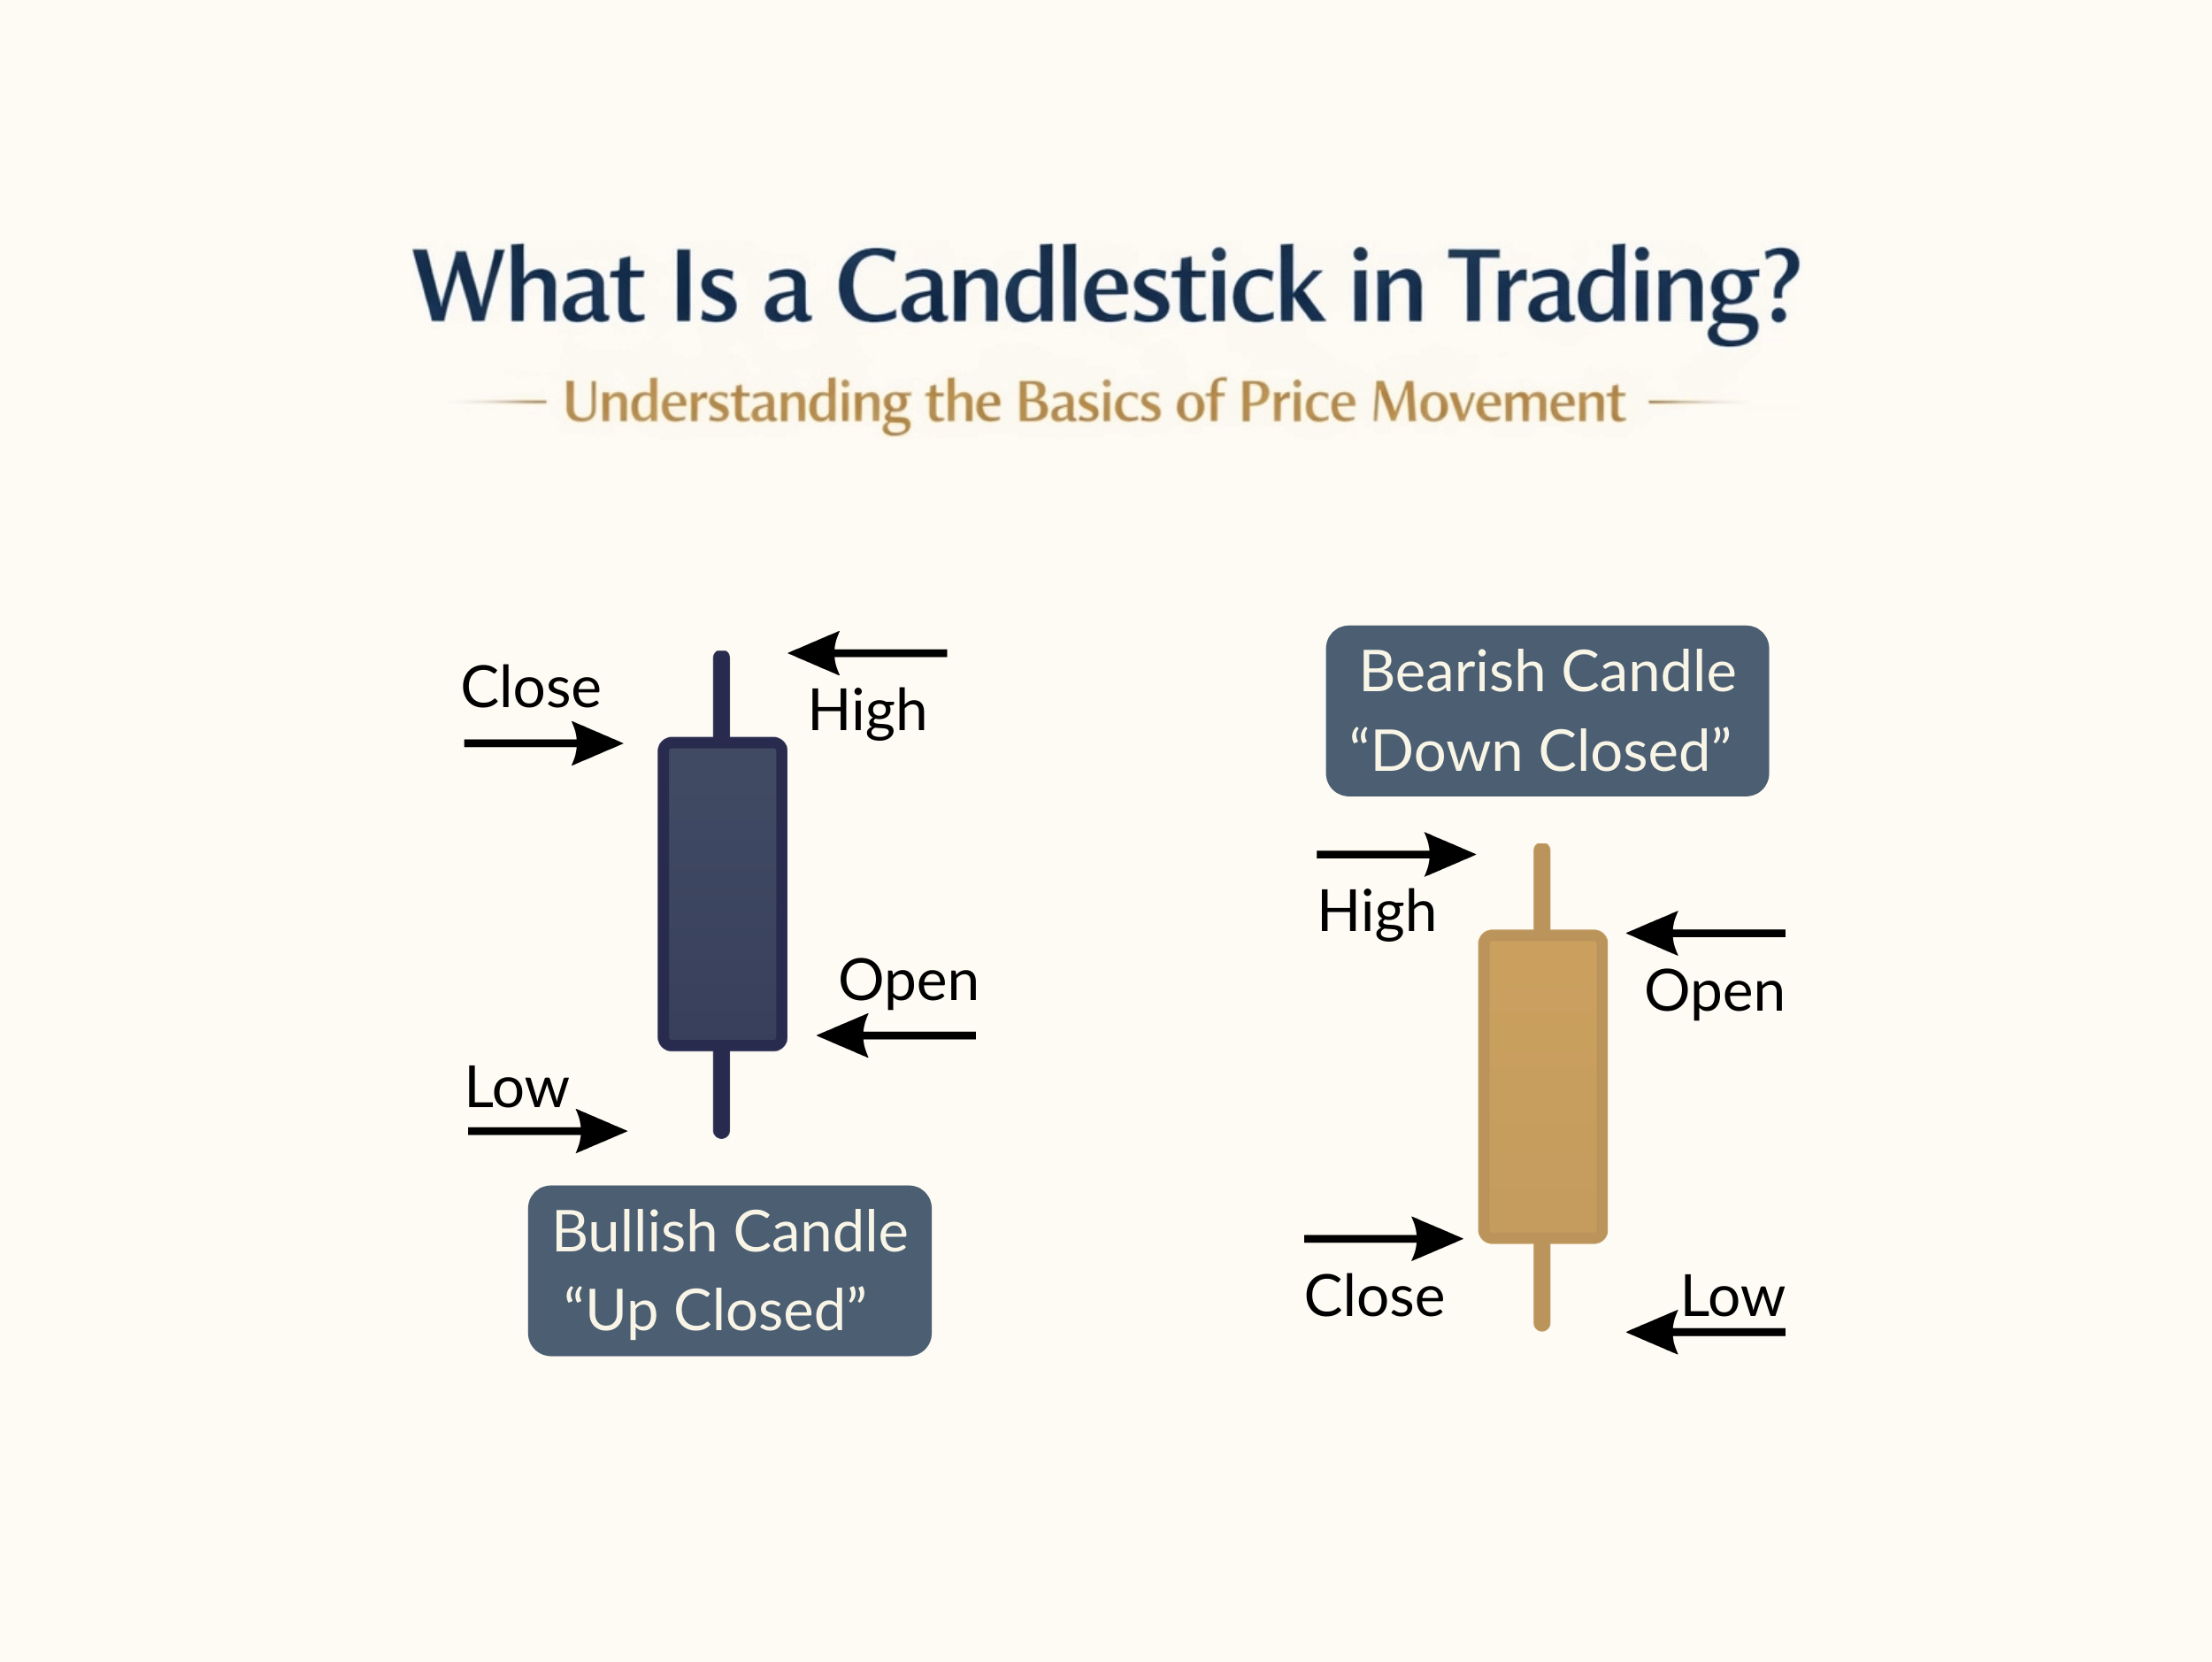
Visual: The anatomy of candlesticks in day trading. The difference between Bullish - Up Closed candle and Bearish - Down Closed candles. You can see the difference between where each candle opens and closes, and the high of the top wick and low of the bottom wick.
What is a candlestick in trading, and what does one candle actually tell you?
If you have ever opened a chart for the first time, candlesticks can look confusing. You see colored bars, thin lines, and constant movement, but it is not always clear what any of it means.
In this lesson, we are keeping it simple. A candlestick is the most basic building block of a chart, and your goal right now is just to understand what one candle tells you about price during a specific period of time.
What is a candlestick in trading?
A candlestick is a visual representation of how price moved during a specific period of time. It shows four key pieces of information: the open, high, low, and close.
Quick Answer: What Is a Candlestick in Trading?
A candlestick shows how price moved during one set period of time on a chart.
It tells you where price opened.
It tells you where price closed.
It shows the highest and lowest points reached during that period.
It gives you a simple visual way to understand how price moved before the candle finished.
How Candlesticks Represent Price Movement?
Every candlestick represents a specific amount of time.
Depending on your chart settings, that could be one minute, one hour, or one day.
During that time, price moves up and down. When the time period ends, the candle closes and shows the full story of what happened during that window.
That is what makes candlesticks so useful for beginners. Instead of seeing random movement, you begin to see price organized into clear time-based pieces.
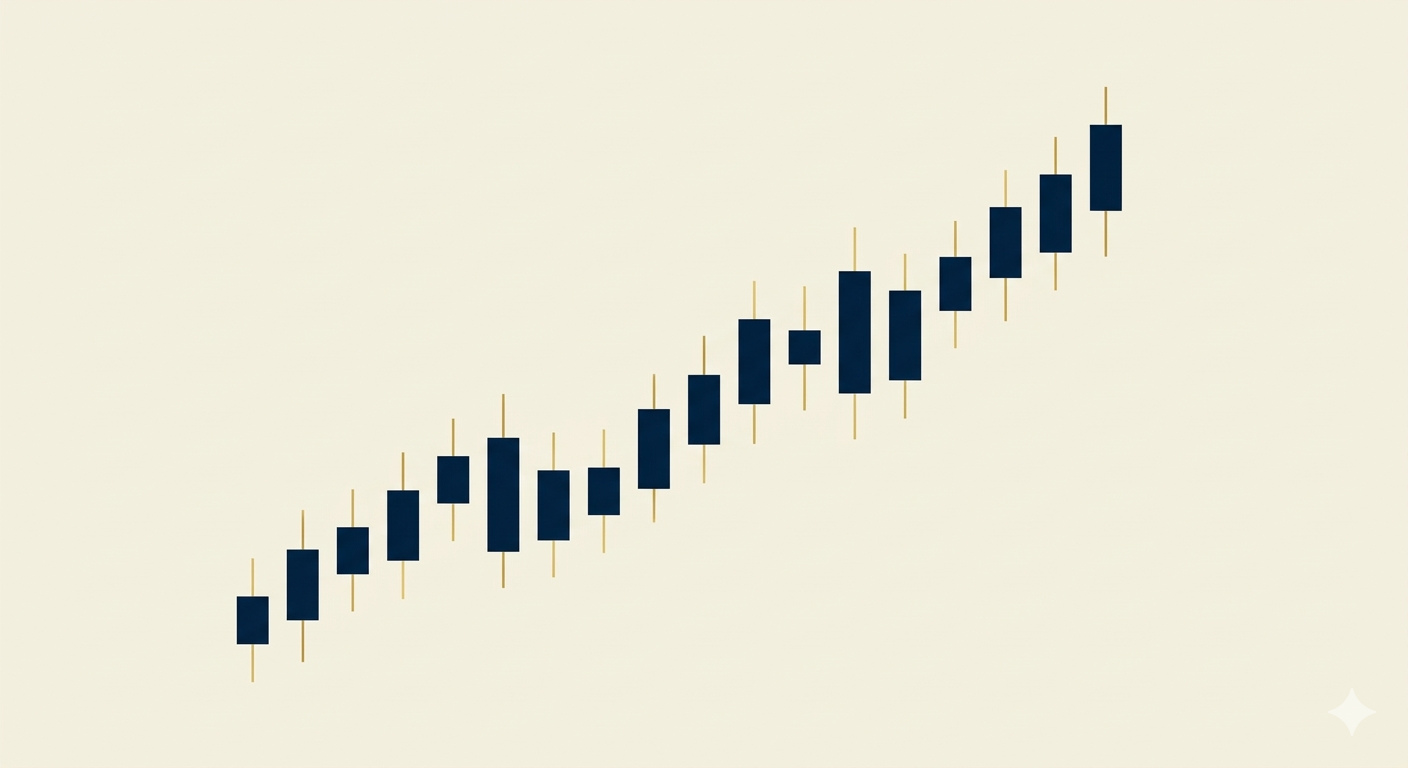
Visual: A simple candlestick chart showing price movement in an up word moving slope.
The Anatomy of a Candlestick
Each candle has four main parts you need to know:
The Open
This is where price started at the beginning of that time period.The Close
This is where price finished when the time period ended.The Body
This is the thick part of the candle. It shows the distance between the open and the close.The Wicks
These are the thin lines above and below the body. They show how far price moved before the candle closed.
You will also notice that candles have different colors.
A green candle means price closed higher than it opened.
A red candle means price closed lower than it opened.
That is the basic job of a candle: it shows where price started, where it ended, and how far it moved in between.
Inside the Foundations Series, this is one of the first chart-reading skills you learn because it helps you understand price before adding anything else.
Simple Candle Example
Imagine you are looking at one candle on a chart.
Price opens here. During that time period, it moves up, dips down, and then closes.
If it closes above the open, the candle will be green.
If it closes below the open, the candle will be red.
The body shows the distance between the open and the close.
The wicks show how far price moved before the candle finished forming.
That means even one candle can tell you a short story about what happened during that small window of time.
Think of It Like This
Think of one candlestick like a snapshot of a short battle between buyers and sellers.
The body shows where that battle started and ended.
The wicks show how far price moved before settling at the close.
You do not need to read anything deeper than that yet. Right now, your only goal is to recognize the parts clearly.
Common Beginner Mistake: Reading One Candle Too Deeply
One of the most common beginner mistakes is trying to treat one candle like a full trade signal before understanding its basic parts.
This usually happens because charts move quickly, and beginners want immediate meaning from every candle they see.
The better approach is slower and simpler.
First, identify the open, the close, the body, and the wicks.
Then notice whether the candle closed up or down.
That is enough for this stage.
You learn to see before you learn to act.
Learn It in Order
Most beginners do not struggle because they lack effort. They struggle because they try to learn too many things at once.
Inside Foundations, these concepts are taught step by step so you can build understanding before moving deeper into chart reading.
Key Takeaways
A candlestick represents one specific period of time on a chart.
It shows the open, high, low, and close of that time period.
The body shows the distance between the open and the close.
The wicks show how far price moved before the candle closed.
A green candle closed above the open, and a red candle closed below the open.
Frequently Asked Questions:
What is a candlestick in trading?
A candlestick shows how the price of an asset moved during a specific time period, including the open, high, low, and close.
What do candlestick wicks represent?
Wicks show the highest and lowest prices reached during the candle’s time period before the final closing price.
Why do traders use candlestick charts?
Candlestick charts show more information than line charts and help traders understand price movement and market sentiment.
What is the difference between a green candle and a red candle?
A green candle closes above its opening price, while a red candle closes below its opening price.
Next Step
Now that you understand what one candle shows, the next step is learning how to use a simple indicator to help you see the average direction of price more clearly.
Read next: Understanding the Exponential Moving Average (EMA)
This Concept Is Part Of: The Agorion Method
This concept is part of the Agorion Method, specifically within the Foundations stage where traders learn how to read price before moving into more advanced concepts.
Candlesticks are one of the first building blocks in that process because they help you understand what the market is doing one piece at a time.
If you want to follow this process from the beginning, start with the Learning Path so you can see how the Agorion Method is designed to build skill step by step.
Continue the Foundations Learning Path
The Foundations Series was created to give women entering day trading a clear step-by-step path to understanding the markets without the noise or overwhelm common in traditional trading education.
Foundations Series Lesson Index
Lesson 1 - What is Leverage in Trading?
Lesson 2 - What is a Candlestick in Trading? (← You are Here)
Lesson 3 - Understanding the Exponential Moving Average (EMA) ( ←READ NEXT)
Lesson 4 - Using the Long/Short Tool to Plan Trades
Lesson 5 - What does a Trending Market Look Like?
Lesson 6 - What is Consolidation in Trading?
Lesson 7 - Spread Basics for Beginner Traders
Lesson 8 - Understanding Market Hours in Trading
Lesson 9 - Risk Management Fundamentals
Lesson 10 - What is Margin in Trading?
Lesson 11 - How These Trading Foundations Work Together
By Rachel Pennington
Rachel Pennington is the founder of The Agorion Collective, a structured trading education platform designed to educate and support women building real skill in the market. Her approach is rooted in clarity before complexity, teaching traders to understand price, manage risk, and develop their own process step-by-step.