What is Consolidation in Trading? A Beginners Guide to Sideways Markets
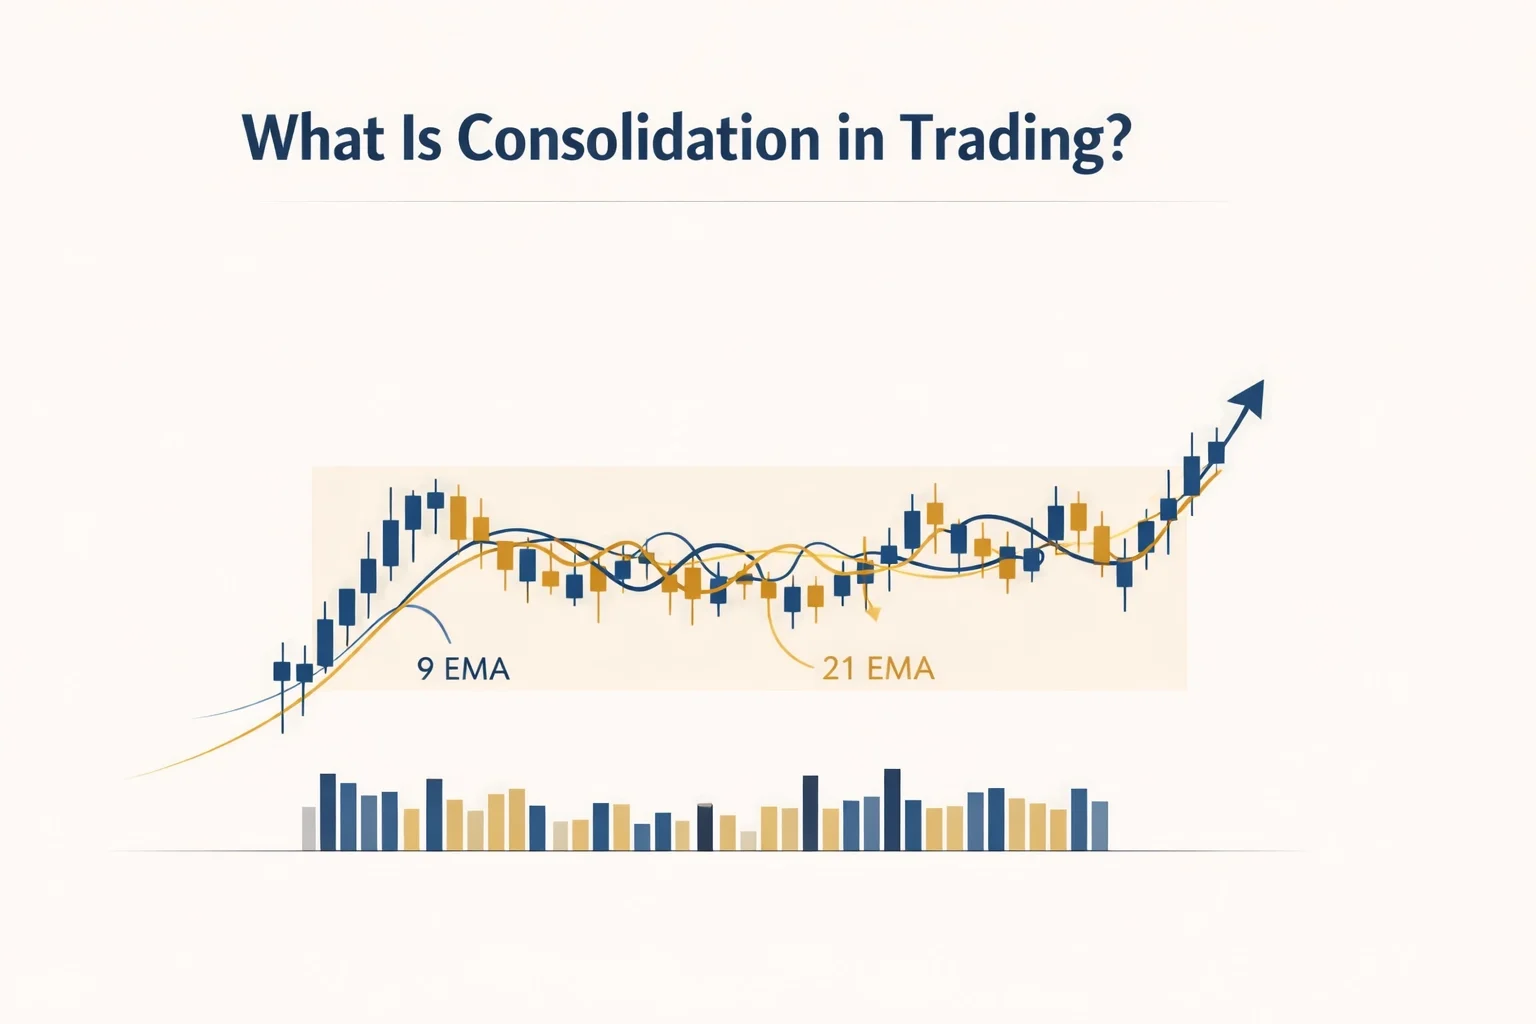
Visual: a clean candlestick chart, an uptrend turned into consolidation - candles started forming next to each other, EMAs are running through the candlesticks instead of above or below and are tangled around each other. Price finally breaks out from the range.
What is consolidation in trading, and how can you tell when the market has stopped moving with clear direction?
Not every chart is trending.
Sometimes price stops making clear progress and starts moving back and forth in a tighter range. That is where many beginners start to feel confused, because the market no longer looks clean or directional.
In this lesson, the goal is simple: learn what consolidation looks like so you can recognize when the market is moving sideways instead of clearly up or down.
What is consolidation in trading?
Consolidation happens when price moves sideways within a range instead of trending clearly in one direction. During consolidation, highs and lows tend to form around similar levels, and price often looks more crowded and overlapping on the chart.
Quick Answer:
Consolidation is a sideways market.
Instead of trending clearly up or down, price moves inside a tighter range.
Candles often overlap each other.
The market looks slower, more crowded, and less directional.
What Consolidation Looks Like
Consolidation is what the market looks like when it stops moving with clear direction.
Instead of building higher highs and higher lows, or lower highs and lower lows, price starts moving back and forth inside a narrower area.
This is usually easy to spot once you know what to look for:
price stays inside a visible range
highs and lows form around similar levels
candles overlap more than they do in a clean trend
the chart starts to look more cluttered than directional
Inside the Foundations Hub, this lesson matters because it teaches you how to tell the difference between a market that is moving clearly and a market that is resting.

Visual: A female day trader sits at a clean desk and takes notes while learning a new concept.
Why Consolidation Happens
A trending market cannot move with clean direction forever.
At some point, price often slows down.
Instead of continuing to push clearly upward or downward, it begins to move sideways.
That sideways movement is consolidation.
You can think of it as the market taking a pause.
Not because something is wrong, but because price is no longer moving with the same clear momentum it had before.
As a beginner, your job is not to predict exactly what comes after consolidation.
Your job is to recognize that the market is no longer trending cleanly right now.
What to Look for on the Chart
One of the clearest ways to recognize consolidation is by drawing a simple box around the sideways movement.
When price keeps rotating back and forth inside that box, the market is showing you that it is not moving with clear direction.
You will often notice:
candles overlapping each other
price failing to make clean progress
the 9 EMA and 21 EMA flattening out
the EMAs running sideways through the candles instead of clearly staying above or below them
That is very different from a clean trend, where price structure looks more open and directional.
If you need a quick refresher on what clear direction looks like before this lesson, review What Does a Trending Market Look Like?.
Think of It Like This
Think of consolidation like the market taking a breath.
A trend is active and directional.
Consolidation is the pause.
Price is no longer moving with the same clean rhythm, so the chart starts to feel tighter, flatter, and less clear.
That does not mean the market is broken.
It just means the market is resting instead of moving cleanly in one direction.
Common Beginner Mistake: Forcing a Trade Inside the Box
One of the most common beginner mistakes during consolidation is trying to force a trade while price is still moving sideways inside the range.
This usually happens because a beginner sees one candle move toward the top or bottom of the box and assumes the market is about to break out.
But inside consolidation, that move often fades quickly and rotates back the other way.
The better habit is to slow down and recognize the environment first.
If price is still boxed in, overlapping, and moving without clear direction, the cleanest decision is often to wait.
The reality is that the market isn't attacking you; it’s just taking a breath. According to Investopedia, “consolidation is a period of indecision.” And If the market hasn't decided where it's going, why should you?
A winning trade without a plan is luck.
Most beginners do not struggle with effort. They struggle with structure.
Inside Foundations, these concepts are taught step by step so you are not trying to force clarity where the chart is still messy.
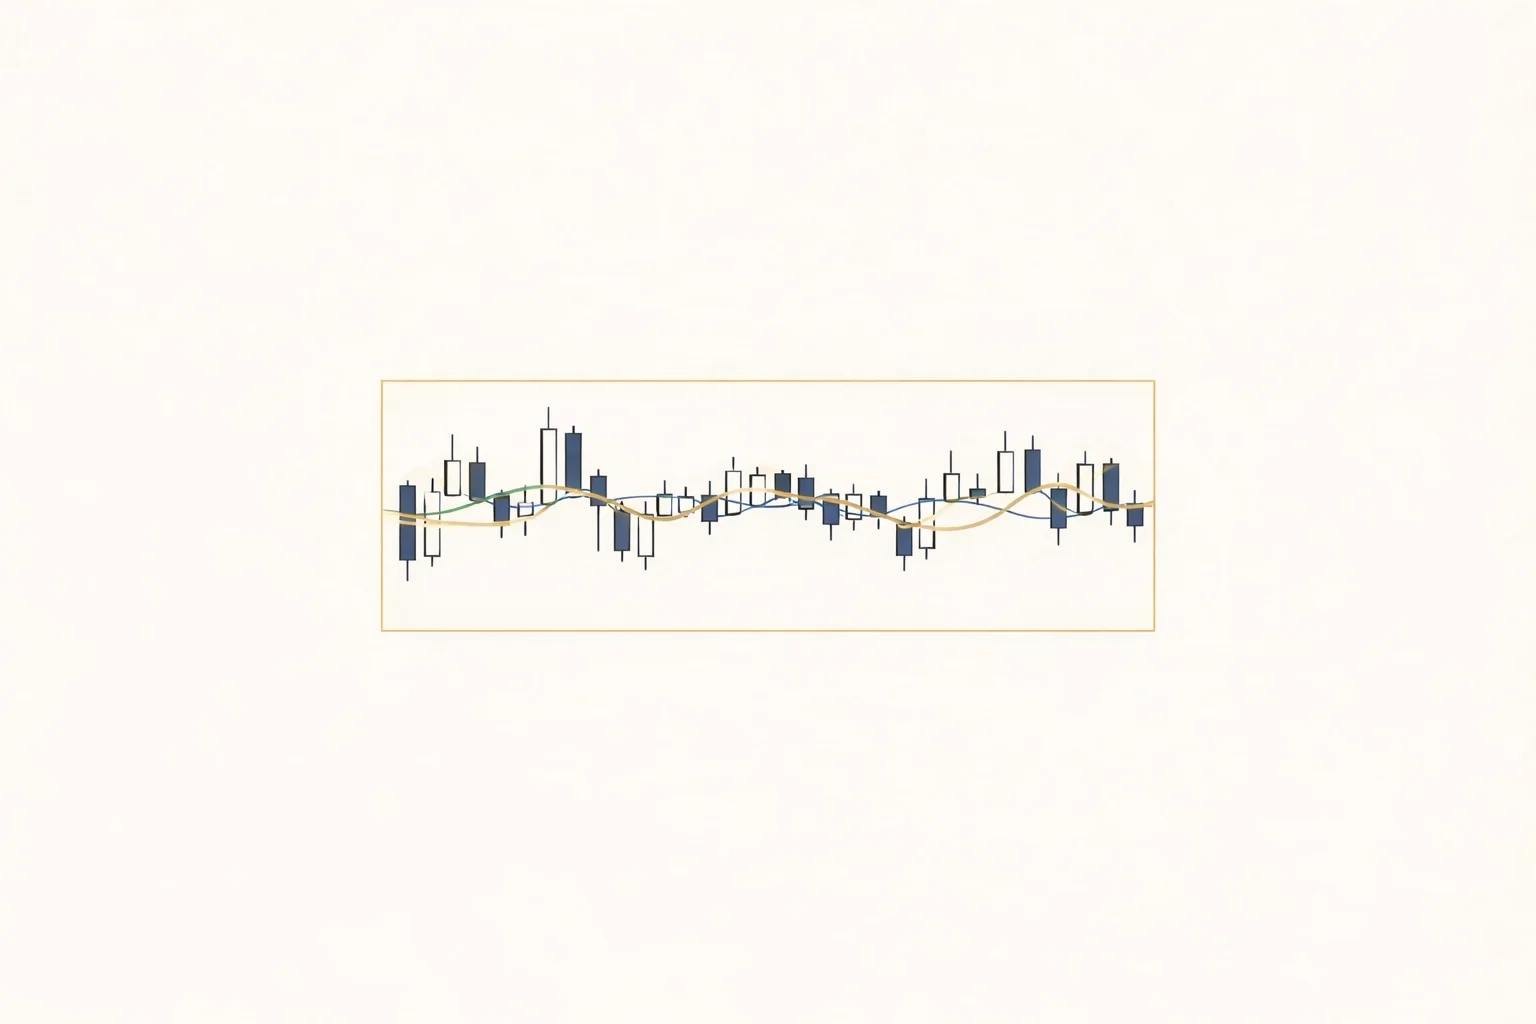
Visual: A consolidated market where candles are not making higher highs or higher lows consistently but rather, they are going back and forth and EMAS are running through them instead of above or below. There is a box drawn around the range to give a clear visual that consolidation is happening, stay out of trades.
Your Practice Exercise:
Open TradingView: Use the 15-minute timeframe. This is a great "middle ground" for seeing market structure.
Look for the "Staircase" to Stop: Find a spot where the price was trending (HH/HL) and then suddenly stops making progress.
Draw a Box: Use the "Rectangle" tool in TradingView. Draw a box around the sideways “messy middle” where price keeps rotating back and forth. Many traders call this a “range,” and simply drawing a box around it can make the structure of the market instantly clearer.
Observe the Overlap: Look at how the candles sit inside that box. Are they overlapping each other? Are the 9 and 21 EMAs moving sideways through candlesticks, wrapped around each other and tangled looking near the middle?
Compare: Look at the areas before and after the box. Notice how much "cleaner" the trending areas look compared to the "cluttered" box.
The goal here isn't to trade the breakout. It’s simply to train your eyes to say, "Hey, look! The market is in a box. It’s resting. I should wait."
Now that you know how to spot the market taking a breath, you’re becoming much more aware of how the markets behave. You’re no longer just guessing; you’re observing.
Homework: Spend 10 minutes on TradingView today finding three "boxes" of consolidation.
If you want to share your charts or ask questions, come join us in The Atrium: our free Foundations tier, community space where women are building these skills together.
Key Takeaways
Consolidation happens when price moves sideways within a range.
It usually appears after the market slows down and stops trending clearly.
Consolidation often looks crowded, overlapping, and less directional.
The 9 EMA and 21 EMA often flatten and run through price during consolidation.
The goal is not to force a trade. The goal is to recognize when the market lacks clear direction.
Frequently Asked Questions
What does consolidation mean in trading?
Consolidation means price is moving sideways within a range instead of trending clearly upward or downward.
How do you recognize consolidation on a chart?
You can recognize consolidation by looking for price staying inside a clear range, with overlapping candles and flatter EMAs moving sideways through price.
Is consolidation good or bad for trading?
It is neither good nor bad by itself. It is simply a market phase. For beginners, it is often harder to trade because price lacks clear direction.
Can consolidation happen after a trend?
Yes. Markets often move from trend into consolidation when price slows down and stops making clean directional progress.
Next Step
Now that you understand what consolidation looks like, the next step is learning about one of the hidden costs that shows up in every trade.
Read next: Spread Basics for Beginner Traders
This Concept Is Part Of: The Agorion Method
This concept is part of the Agorion Method, specifically within the Foundations stage where traders learn to recognize market conditions before trying to execute with more precision.
Consolidation matters because it teaches you when the market is not giving you clean direction, which is just as important as recognizing when it is.
Continue the Foundations Learning Path
The Foundations Series was created to give women entering day trading a clear step-by-step path to understanding the markets without the noise or overwhelm common in traditional trading education.
Foundations Series Lesson Index
Lesson 1 - What is Leverage in Trading?
Lesson 2 - What is a Candlestick in Trading?
Lesson 3 - Understanding the Exponential Moving Average (EMA)
Lesson 4 - Using the Long/Short Tool to Plan Trades
Lesson 5 - What does a Trending Market Look Like?
Lesson 6 - What is Consolidation in Trading? (← You are Here)
Lesson 7 - Spread Basics for Beginner Traders (Read Next - Linked above)
Lesson 8 - Understanding Market Hours in Trading
Lesson 9 - Risk Management Fundamentals
Lesson 10 - What is Margin in Trading?
Lesson 11 - How These Trading Foundations Work Together
If you want to follow this process from the beginning, start with the Learning Path so you can see how
the Agorion Method is designed to build skill step by step.
By Rachel Pennington
Rachel Pennington is the founder of The Agorion Collective, a structured trading education platform designed to educate and support women building real skill in the market. Her approach is rooted in clarity before complexity, teaching traders to understand price, manage risk, and develop their own process step-by-step.