Higher Highs and Lower Lows: How to Read Market Structure
When beginners first open a price chart, the movement can feel close to random. Price climbs, drops, climbs again, and none of it seems to mean anything in particular. But it does actually mean something. Underneath the movement is a simple structure, and once you can see it, a chart stops looking like noise and starts looking like a record of who is winning, buyers or sellers. That structure is built from highs and lows, and the way those highs and lows line up is what tells you which direction the market is actually moving. This is the heart of what a trending market looks like, and learning to read it before you react to it is part of why Agorion teaches clarity before complexity.
What are higher highs and lower lows in trading?
Higher highs and higher lows describe an uptrend: each push upward reaches a new high, and each pullback stops above the previous low. Lower highs and lower lows describe a downtrend: each bounce falls short of the last high, and each drop goes below the previous low. Reading those swing points is how you tell, at a glance, whether buyers or sellers are currently in control.
Quick Answer
Market structure is the pattern your highs and lows make as price moves over time.
Uptrend: higher highs (HH) and higher lows (HL). Buyers in control.
Downtrend: lower highs (LH) and lower lows (LL). Sellers in control.
No clear pattern: highs and lows sitting at about the same level usually means the market is consolidating, and there is no trend to read yet.
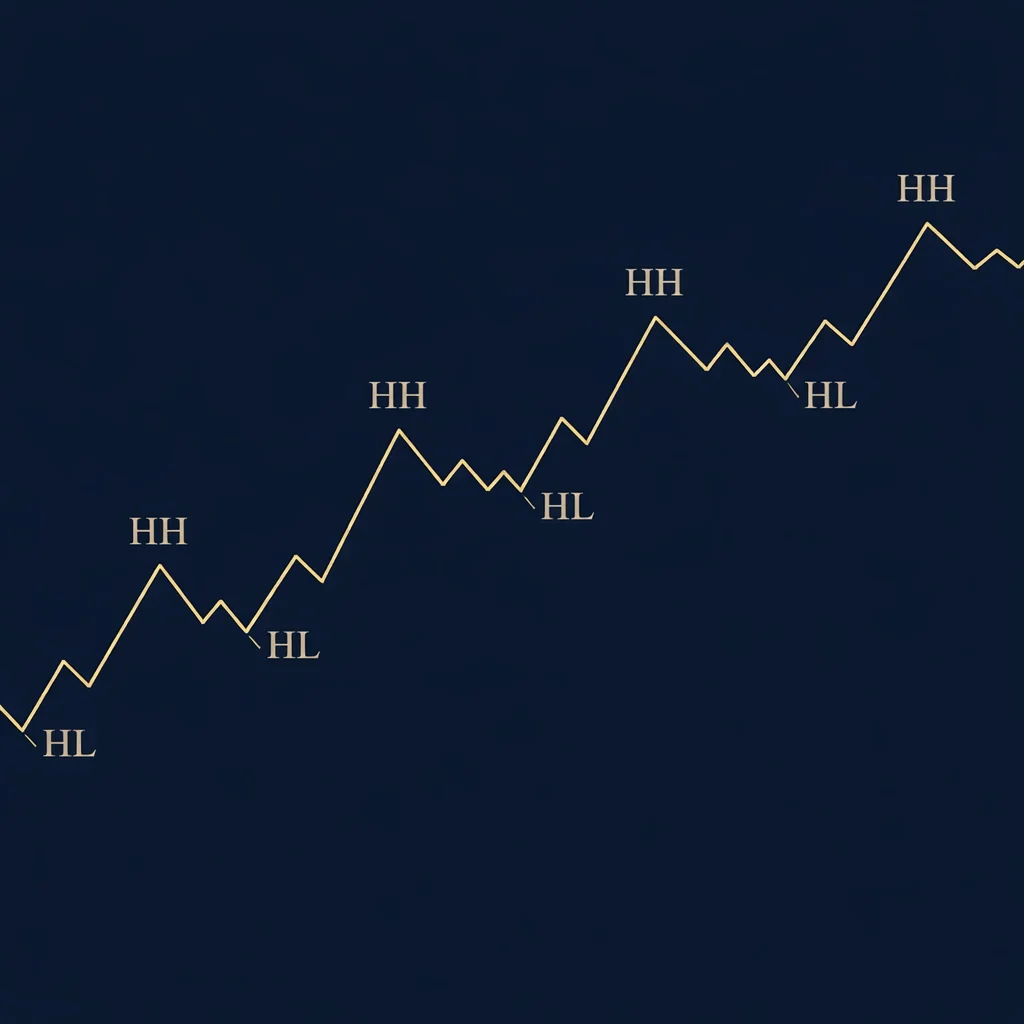
Pictured:
The Graph depicts market structure in a Bullish trending market, or Uptrend. Each high goes higher than the previous and each pullback ends higher than the previous.
A Bearish trending market, or downtrend - flips this visual and you will see Lower Lows (LL) and Lower Highs (LH) created.
Price moves in swings, not straight lines
Price almost never travels in a clean line. It pushes in one direction, pauses or pulls back, then pushes again. Each of those pushes and pullbacks is made of individual candlesticks, and when you step back from any single candle, those candles group into waves. The top of a wave is a swing high. The bottom of a pullback is a swing low. Market structure is simply the relationship between one swing high and the next, and one swing low and the next.
This is why reading a chart one candle at a time tends to confuse beginners. A single red candle inside a strong uptrend can look alarming on its own. Seen as part of the structure, it is often just the pullback before the next higher high forms.
Reading an uptrend:
higher highs and higher lows
In an uptrend, price stair-steps upward. It pushes up to a high, pulls back to a low that stays above the previous low, then pushes up again to a high that clears the top of the previous one. Each peak is higher than the last. Each dip is higher than the last. That repeating shape, higher highs sitting on top of higher lows, is buyers staying in control through each pullback. The pullbacks are not the trend failing. They are the part of the rhythm where the market catches its breath before continuing.
Reading a downtrend:
lower highs and lower lows
A downtrend is the same logic in reverse. Price drops to a low, bounces to a high that falls short of the previous high, then drops again to a low beneath the last one. Each bounce is weaker than the one before it. Each low is deeper. Lower highs stacked above lower lows is sellers keeping control. As with an uptrend, the bounces are part of the structure, not evidence that the down move is over.
How to read market structure step by step
You do not need an indicator to read structure. You need to slow down and look at the sequence.
Zoom out until you can see several swings on screen, not one or two candles.
Mark the obvious swing highs and swing lows, the clear peaks and dips, not every tiny wiggle.
Compare each high to the high before it, and each low to the low before it.
Name the pattern. Higher highs with higher lows is an uptrend. Lower highs with lower lows is a downtrend.
Check for consolidation. If the highs and lows are roughly level and the candles are horizontal, the market is not trending right now.
Trend-check the direction.The EMA is a beginner-friendly visual guide here, not a strategy on its own:
a rising EMA usually agrees with an uptrend, and a falling (down sloped) EMA usually agrees with a downtrend. If your read of the swings and the slope of the EMA disagree, that is your cue to slow down, not to force a call.
A way to picture it
Imagine a staircase. In an uptrend, you are walking up: every landing (the highs) is higher than the last, and every step you set your foot on (the lows) is higher than the last. In a downtrend, you are walking down the same staircase, each landing and each step lower than the one before. When the steps stop climbing or falling and you are just pacing back and forth on one landing, that is consolidation. The staircase keeps the idea simple:
you are not judging any single step, you are noticing which way the staircase is going.
If the chart still feels busy, that is normal at this stage. You learn to see before you learn to act. Inside Foundations, market structure is taught right next to candles and the EMA, so each piece has somewhere to sit instead of arriving all at once.
The most common beginner mistake
The most common mistake is reacting to a single candle instead of reading the swing structure around it. A beginner sees one strong red candle in an uptrend and assumes the move is finished, exits or flips direction, and then watches price make a higher low and continue up without them.
This happens because the eye is still reading candles one at a time rather than reading the pattern they form. The fix is in creating a behavior, not following a feeling:
before you decide a trend is over, wait to see what the pullback does. If it forms a higher low, the uptrend is intact. If it breaks below the previous low, the structure could genuinely be changing, and that is information worth respecting. Letting the structure confirm itself keeps you from fighting a trend that is still running.
Key Takeaways
Price moves in swings, so read the pattern of highs and lows, not individual candles.
Higher highs and higher lows mean an uptrend, with buyers in control.
Lower highs and lower lows mean a downtrend, with sellers in control.
Overlapping, roughly level highs and lows usually mean consolidation, with no trend to read yet.
One pullback is not a reversal. The structure changes only when the pattern of highs and lows changes.
Frequently Asked Questions
What is a higher high in trading?
A higher high is a swing high (a peak in price) that rises above the previous swing high. When you see higher highs paired with higher lows, the market is in an uptrend and buyers are in control.
What is the difference between a higher low and a lower low?
A higher low is a pullback that stops above the previous low, which supports an uptrend. A lower low is a drop that falls below the previous low, which supports a downtrend. Tracking whether your lows are rising or falling is one of the fastest ways to read direction.
How do I know if a market is trending or consolidating?
Compare recent highs and lows. If both are rising or both are falling, the market is trending. If the highs and lows are sitting at about the same level and candles are overlapping, the market is consolidating, which means there is no clear trend to read at the moment.
Do higher highs and lower lows work on all markets?
Yes. Market structure is a way of reading price itself, so the same higher-high and lower-low logic applies across forex, futures, options, indices, and crypto. What changes from one market to the next is the speed and the smoothness of the swings, not the structure underneath them.
NEXT STEP
Once you can read trend structure, the next thing to recognize is when that structure stops. When the highs and lows flatten out and candles begin to overlap, the market is consolidating, and trading gets harder. Learn what consolidation looks like so you can tell when there is simply no trend to trade.
This Concept Is Part Of:
This article is part of the Agorion Teaching Method, where each concept builds on the one before it. Market structure sits between learning to read candles and learning to recognize consolidation.
If you want to see how market structure fits with the rest of the basics, the Foundations Series lays out the full beginner series in order, from candles through risk management, so you can learn each piece in sequence rather than in isolation. Start with the Foundations Series to follow the Agorion Method step by step.
By Rachel Pennington
Rachel Pennington is the founder of The Agorion Collective, a structured trading education platform designed to educate and support women building real skill in the market. Her approach is rooted in clarity before complexity, teaching traders to understand price, manage risk, and develop their own process step-by-step.